mars.dataframe.DataFrame.plot.area#
- DataFrame.plot.area(*args, **kwargs)#
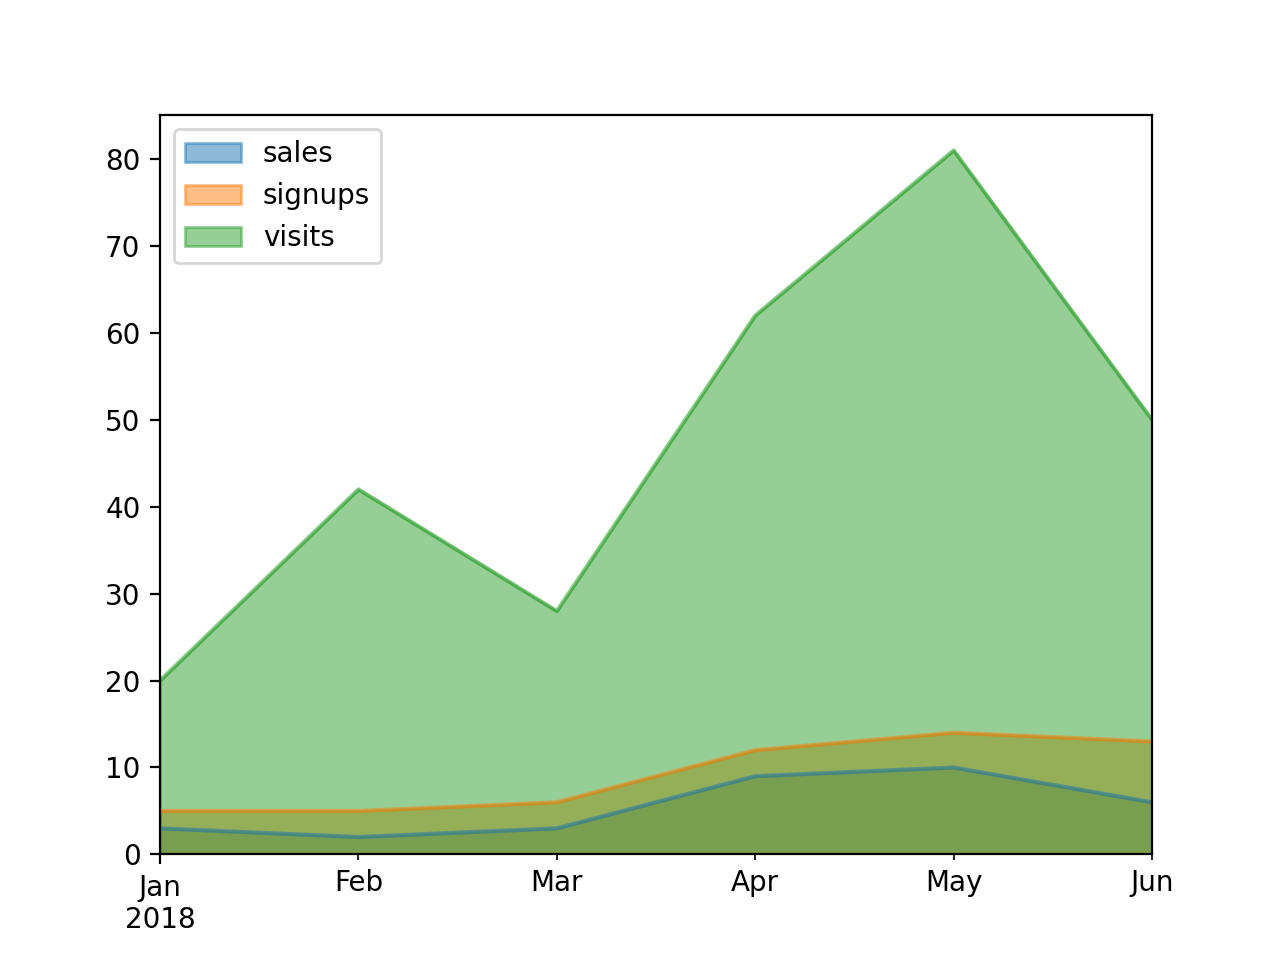
Draw a stacked area plot.
An area plot displays quantitative data visually. This function wraps the matplotlib area function.
- Parameters
x (label or position, optional) – Coordinates for the X axis. By default uses the index.
y (label or position, optional) – Column to plot. By default uses all columns.
stacked (bool, default True) – Area plots are stacked by default. Set to False to create a unstacked plot.
**kwargs – Additional keyword arguments are documented in
DataFrame.plot().
- Returns
Area plot, or array of area plots if subplots is True.
- Return type
See also
DataFrame.plotMake plots of DataFrame using matplotlib / pylab.
Examples
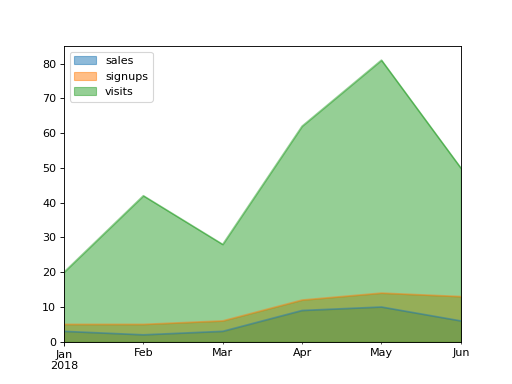
Draw an area plot based on basic business metrics:
(Source code, png, hires.png, pdf)

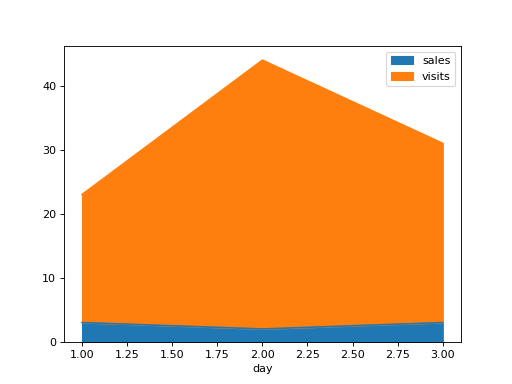
Area plots are stacked by default. To produce an unstacked plot, pass
stacked=False:(Source code, png, hires.png, pdf)
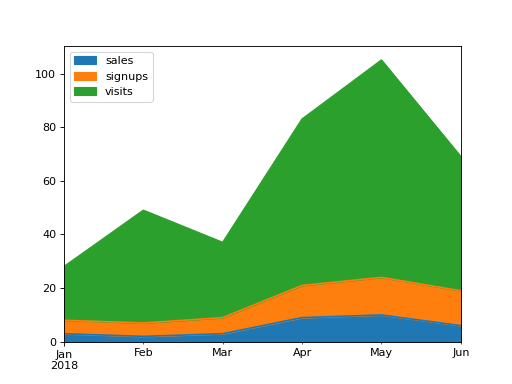
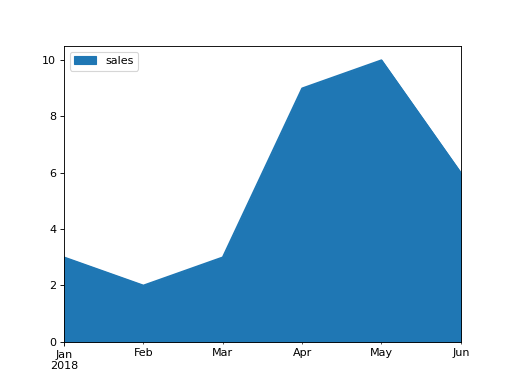
Draw an area plot for a single column:
(Source code, png, hires.png, pdf)

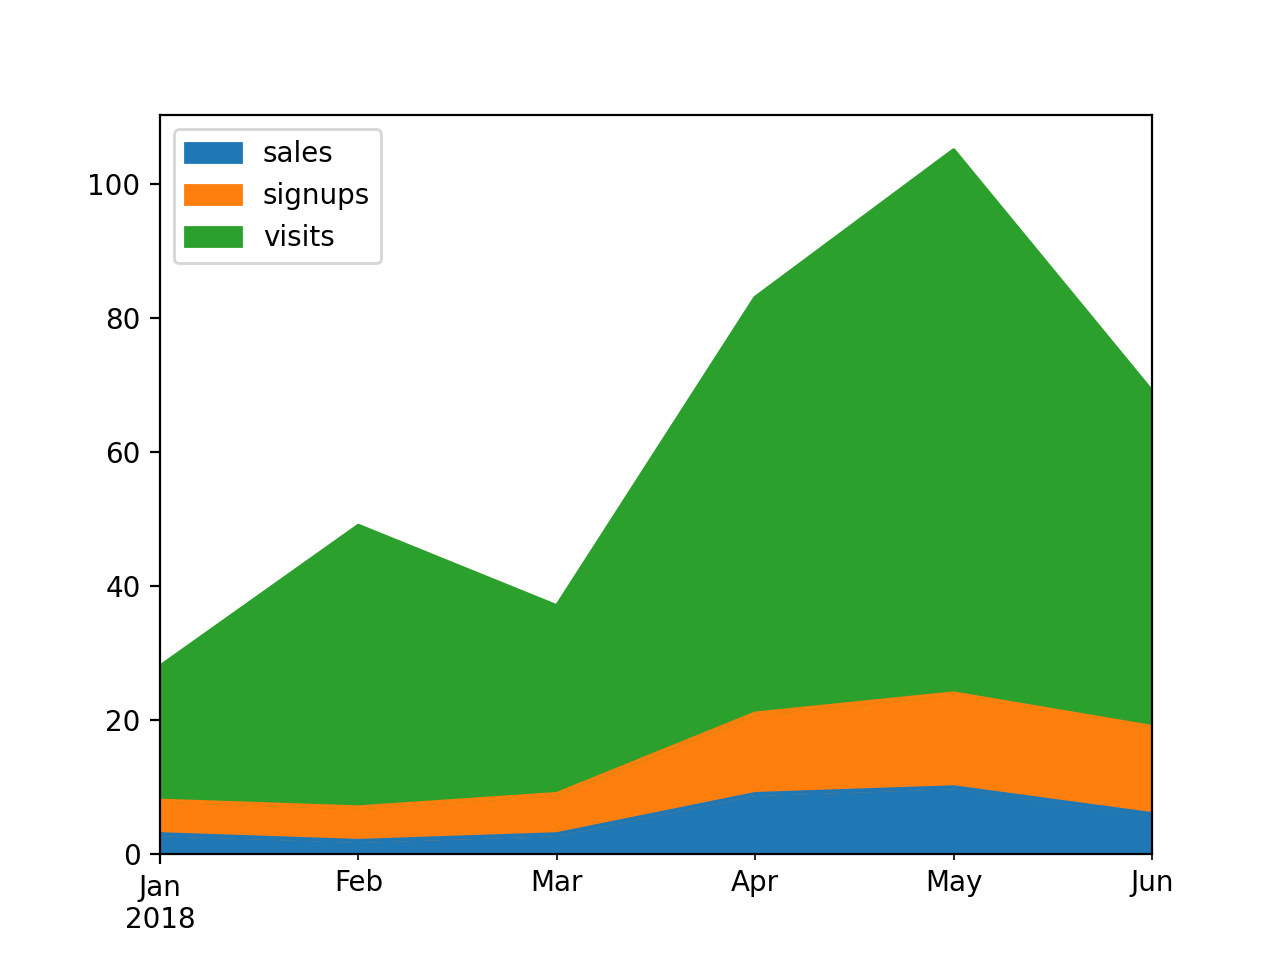
Draw with a different x:
(Source code, png, hires.png, pdf)